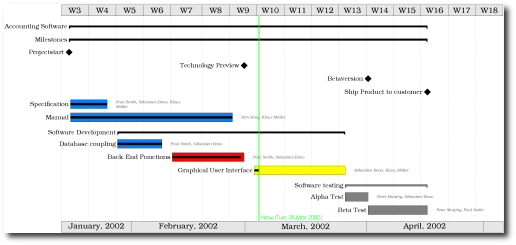
Last week I was faced with a problem I had 2 years ago: generating Gantt graphs for our projects. While at IBM/LTC, I found TaskJuggler to be a nice tool, very developer oriented, but it lacked means to generate nice graphs... I've requested this feature in 2005, it got implemented by Chris, but one issue still remain: how to generate those automatically, without any UI, and in a scalable format to be used in our LaTeX reports and maybe some multi-page poster.
So this weekend I implemented this tool and it's quite usable already! It's a Python+ElementTree+PyX application that parsers TaskJuggler's XML (tjx) and output PDF, PS or EPS, with PDF and PS being able to output segmented, multi page, poster documents.
Chenca is developing a more report oriented graph, generating LaTeX tables instead of drawings, he promised to publish it as well ;-)
Source is available at: http://barbieri-playground.googlecode.com/svn/python/taskjuggler-utils/ (SVN)
